Metal for GPGPU
I’m working on the swift port of ConvnetJS - a deep learning library. And I’m thinking about GPU acceleration for this project in Metal. So I performed some quick tests to see how much I can gain in performance with Metal and on which data sizes. I chose sigmoid \(y = {1 \over 1+e^{-x}}\), rectifier \(y = max(0, x)\) and hyperbolic tangent \(y = {e^{2x}-1 \over e^{2x}+1}\) functions for my experiments because they are important activation functions in neural networks. All tests were performed on the iPhone 5s iOS 9.1 (13B143).
Functions to test
Metal kernels:
#include <metal_stdlib>
using namespace metal;

kernel void sigmoid(const device float *inVector [[ buffer(0) ]],
                    device float *outVector [[ buffer(1) ]],
                    uint id [[ thread_position_in_grid ]]) {
    outVector[id] = 1.0 / (1.0 + exp(-inVector[id]));
}

kernel void rectifier(const device float *inVector [[ buffer(0) ]],
                    device float *outVector [[ buffer(1) ]],
                    uint id [[ thread_position_in_grid ]]) {
    outVector[id] = max(0.0, inVector[id]);
}

kernel void tanh(const device float *inVector [[ buffer(0) ]],
                      device float *outVector [[ buffer(1) ]],
                      uint id [[ thread_position_in_grid ]]) {
    outVector[id] = tanh(inVector[id]);
}
Two Swift implementation with map and for loop respectively:
func sigmoid(vec: [Float]) -> [Float] {
    var res: [Float] = []
    for i: Int in 0 ..< vec.count {
        res.append(1.0 / (1.0 + exp(-vec[i])))
    }
    return res
}

func sigmoidM(vec: [Float]) -> [Float] {
    let res = vec.map({ (elem: Float) -> Float in
        return 1.0 / (1.0 + exp(-elem))
    })
    return res
}
Rectifier and hyperbolic tangent functions were implemented in similar fashion.
Measurment block:
import UIKit
import Metal
import QuartzCore

func executionTimeInterval(block: () -> ()) -> CFTimeInterval {
    let start = CACurrentMediaTime()
    block();
    let end = CACurrentMediaTime()
    return end - start
}

func myVector(len: Int) -> [Float] {
    var myvector = [Float](count: len, repeatedValue: 0)

    for (index, _) in myvector.enumerate() {
        myvector[index] = Float(index)
    }
    return myvector
}

class ViewController: UIViewController {

    override func viewDidLoad() {
        super.viewDidLoad()

        let elemNumArray = [1,10,100,1000,10000,100000,1000000,10000000]

        for elemNum in elemNumArray {
            let driver = MetalDriver()
            let myvector = myVector(elemNum)

            do {
                let metal = executionTimeInterval {
                    _ = driver.metalComputeFuncton("tanh", param: myvector)
                }
                print(metal)
            }
        }

        // Other functions were tested in the same way.
    }
}
Results
Data (in seconds)
Sigmoid:
| Metal | for loop | map | |
|---|---|---|---|
| ×1 | 0.0564465416 | 0.000349125 | 0.00016975 |
| ×10 | 0.0021658333 | 0.0000578 | 0.0000655 |
| ×100 | 0.0028236667 | 0.0000907 | 0.0000672 |
| ×1000 | 0.0021074583 | 0.0006860833 | 0.0006257084 |
| ×10000 | 0.0038219166 | 0.0063114166 | 0.0065755 |
| ×100000 | 0.0098142499 | 0.0634174166 | 0.0634255416 |
| ×1000000 | 0.06469075 | 0.63862575 | 0.6045135832 |
| ×10000000 | 0.7409762917 | 6.3516480417 | 6.35516875 |
Rectifier:
| Metal | for loop | map | |
|---|---|---|---|
| ×1 | 0.0049757083 | 0.00018075 | 0.0001782917 |
| ×10 | 0.0032745417 | 0.0001197084 | 0.0000144 |
| ×100 | 0.0020335417 | 0.0000966 | 0.0000674 |
| ×1000 | 0.003079125 | 0.0007750001 | 0.0006028333 |
| ×10000 | 0.0038103334 | 0.0072056249 | 0.0060474999 |
| ×100000 | 0.0098598334 | 0.0687627917 | 0.0607689167 |
| ×1000000 | 0.0700035417 | 0.6864432917 | 0.607680875 |
| ×10000000 | 0.7093120418 | 6.8916719584 | 6.093184 |
Hyperbolic Tanhent:
| Metal | for loop | map | |
|---|---|---|---|
| ×1 | 0.095888125 | 0.000841625 | 0.000172875 |
| ×10 | 0.0030728333 | 0.0000663 | 0.0000433 |
| ×100 | 0.0019839583 | 0.00016625 | 0.000088 |
| ×1000 | 0.0029159584 | 0.0006575417 | 0.0006404166 |
| ×10000 | 0.0037110833 | 0.0062489166 | 0.00606475 |
| ×100000 | 0.0097689166 | 0.0632590416 | 0.0606999584 |
| ×1000000 | 0.0587829167 | 0.63312125 | 0.6082397084 |
| ×10000000 | 0.5905967084 | 6.3275603751 | 6.08179275 |
Bar charts

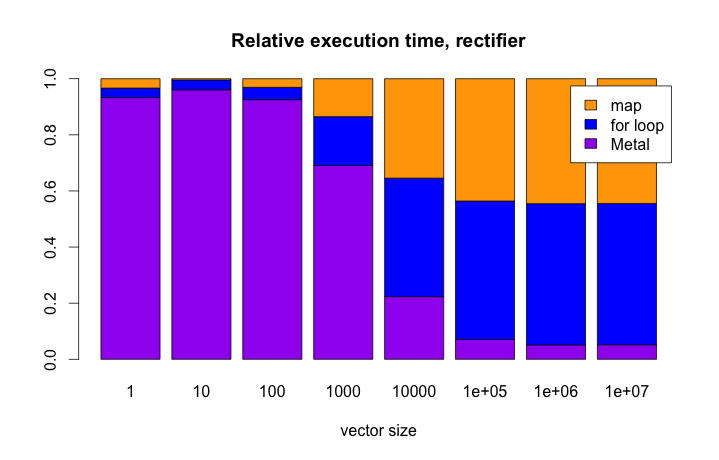
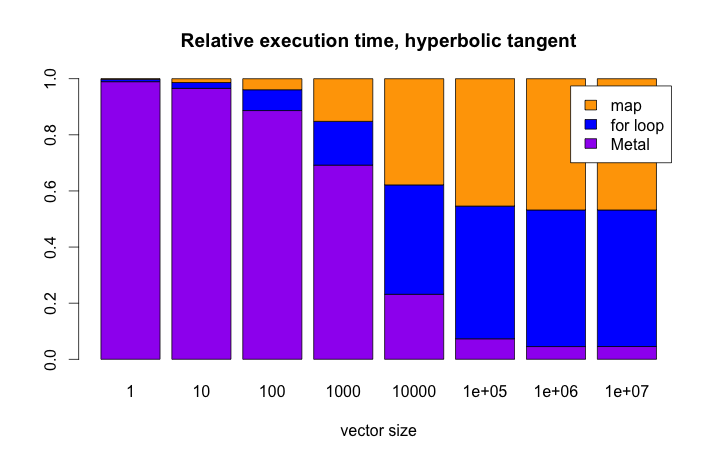
The full height of each bar represents the time spent by all three implementations (Metal, for loop and map) in total. The height of each colourful segment on the plot is the time spent by the function in comparison to the time spent by two other functions.
It should be clear from the plot, that if you’re operating with the vectors of less than 10 000 elements there is no point to use Metal. On the other hand, if your data is sufficiently big, there is no reason not to use Metal on iOS or latest OS X.
R script to generate bar graphs
d = read.csv("test_tanh.csv")
rownames(d) = d[,1]
d = d[,2:4]
m = apply(d, 1, sum) # sum of each row
r = sweep(d, 1, m, `/`) # scale all rows
rownames(r) = as.character(c(1,10,100,1000,1e+04,1e+05,1e+06,1e+07))
colnames(r) = c("Metal", "for loop", "map")
barplot(t(r), col = c("purple", "blue", "orange"), legend.text = colnames(r), xlab = "vector size", main = "Relative execution time, hyperbolic tangent")
Useful links
- GPGPU Performance of Swift/Metal vs Accelerate on iPhone 6 & 5S, iPad Air and iPad Mini - this article is much more detailed than mine. Unfortunately, I found it only when I’ve already finished this post.
- Exploring GPGPU on iOS (with OpenGL ES).
- Data-Parallel Programming with Metal and Swift for iPhone/iPad GPU - some useful pieces of code.
- Calculate execution time for a block of Swift code - gist.